What’s behind the resilience of US equity prices – market structure, earnings expectations or equity risk premia?
Prepared by Magdalena Grothe, Ana-Simona Manu and Toma Tomov
Published as part of the ECB Economic Bulletin, Issue 8/2024.
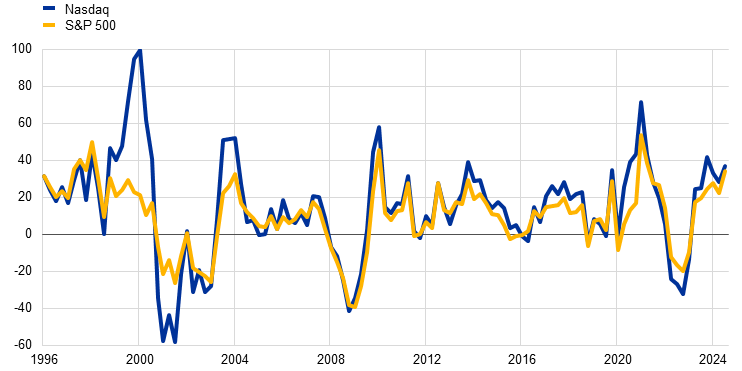
Increases in US equity prices since early 2023 have led to elevated valuations, particularly for the so-called Magnificent Seven firms. US equity prices have risen by almost 60%, despite the Federal Reserve System’s monetary tightening and numerous geopolitical shocks. Year-on-year returns of over 20% have been observed in each quarter of 2024 (Chart A, panel a). The equity returns of the best-performing stocks – those of the large tech companies Alphabet, Amazon, Apple, Meta, Microsoft, Nvidia and Tesla, frequently referred to as the “Magnificent Seven” – have significantly outpaced the rest, increasing by around 75% in 2023 and 45% in 2024. This has driven their valuations, in price-to-earnings (P/E) ratio terms, up to around 30 – well above the median level for S&P 500 companies, which is 20, and above the long-term median level of 17 (Chart A, panel b).[1] While the recent returns of most S&P 500 companies have not been as high as the returns of the technology firm-dominated Nasdaq index 25 years ago, these developments are worth assessing in the light of the experience of the dot-com period. As in that period, which was fuelled by widespread enthusiasm for the internet, tech firms’ current market performance has been buoyed by strong optimism surrounding new technology such as artificial intelligence (AI). Analysts and media commentators have therefore been exploring the similarities and differences between the two episodes.[2] Against this background, this box sheds light on the factors behind the US equity market resilience by discussing the role of market structure, earnings expectations and equity risk premia.
Market capitalisation is now significantly more concentrated than in the past, also including the dot-com bubble. While the dot-com boom encompassed numerous highly leveraged small start-ups (many of which were not included in the S&P 500, but rather in the Nasdaq index), the AI boom is concentrated among the highest-performing and largest S&P 500 companies. At current market prices, the “Magnificent Seven” stocks account for around one-third of the entire market capitalisation of the S&P 500, compared with one-fifth five years ago. The significant role of these companies in current index valuations and market capitalisation contrasts sharply with the dot-com boom, when the top seven firms accounted for only 17% of the S&P 500’s market capitalisation – about half of today’s share. Large US technology companies also have more market power and higher profit margins, at around 20%, than the average US information technology (IT) company in the late 1990s, which had profit margins ranging from 5% to 10%. Moreover, unlike many of the dot-com start-ups that relied on leverage, the “Magnificent Seven” companies have ample cash reserves and cheap access to external financing, enabling them to invest in research and development and to acquire smaller companies and competitors.[3] Barriers to entry (e.g. large fixed costs in chipmaking and cloud services and the first-mover advantage in the development of large language models and search engines) help such companies preserve their market share and capture value, possibly at the expense of other – smaller – companies.
Chart A
US equity returns and price-to-earnings ratios
a) Equity returns
(percentages)

b) Forward price-to-earnings ratios
(P/E ratio)

Sources: Bloomberg, LSEG and ECB staff calculations.
Notes: In panel a), the lines denote the year-on-year returns of the S&P 500 and Nasdaq indices (data as at the end of each quarter). In panel b), the grey areas denote forward P/E ratios across percentiles of firms in the S&P 500. The blue and yellow lines correspond to the median of the S&P 500 index and to the median of the Magnificent Seven for the most recent years, respectively. The latest observations for panel a) are for Q3 2024 (quarterly data). The latest observations for panel b) are for 29 November 2024 (weekly data).
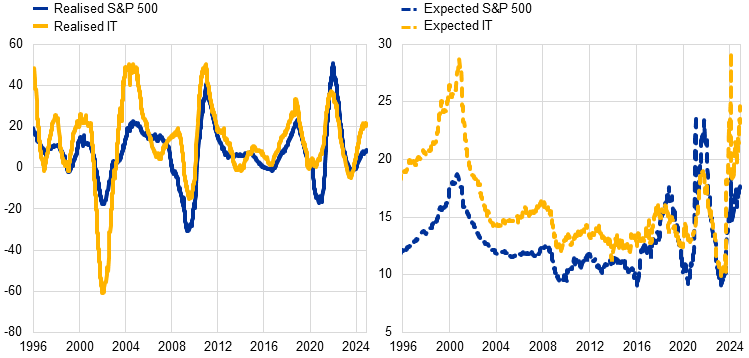
Strong expected earnings in the US tech sector, based on hopes for large productivity gains linked to the AI revolution, have driven its equity prices. The “Magnificent Seven” stocks have recorded very high realised earnings in recent years, which has fuelled expectations of further earnings growth and contributed to their stock prices outperforming others. Market analysts expect double-digit earnings growth for the S&P 500 in 2025 and 2026, well above the long-term average (Chart B). AI-related productivity gains arguably underpin these expectations, as AI has been increasingly mentioned in S&P 500 companies’ earnings reports.[4] However, from the historical perspective of the broader market, earnings growth of around 18%, as is currently expected for the S&P 500 over the next years, has been realised relatively rarely. For example, in the dot-com bubble in 2000 expected earnings were similarly high, while realised earnings were initially strong, but fell substantially afterwards. Moreover, due to the above-mentioned structural factors, the proportion of AI-related gains that will accrue to the wider corporate sector is uncertain.
Chart B
Long-term earnings per share growth and realised earnings for S&P 500 firms and the information technology (IT) sector
(percentages)

Sources: IBES via LSEG and ECB staff calculations.
Notes: Long-term earnings per share growth refers to the median growth rate expected over a three-to-five-year period. Realised earnings growth is shown over one year. The latest observations are for 29 November 2024 (weekly data).
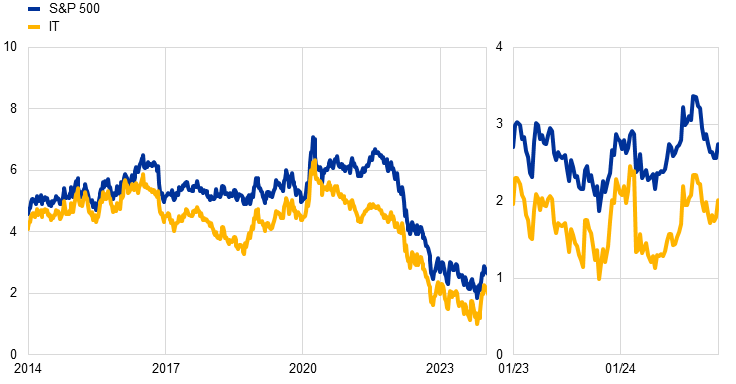
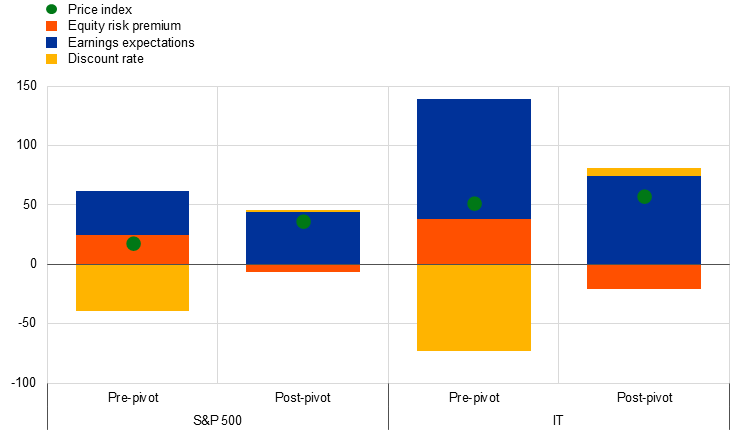
Model analysis also points to risk appetite playing a significant role as a driver of the rise in US equity prices, with equity risk premia at multi-year lows. Insights from the dividend discount model for the S&P 500 and IT stocks reveal that investor risk appetite has been a significant driver of rising equity prices. This trend has been particularly evident since 2022, when estimates of equity risk premia dropped to multi-year lows (Chart C, panel a). Several factors may have contributed to the low levels of equity risk premia and ample risk appetite, such as progress in bringing down inflation without signs of a recession, or subdued demand for tail risk protection.[5] Equity risk premia have been particularly low for the IT sector, which includes some of the “Magnificent Seven” stocks. Together with strong expected earnings, historically low equity risk premia were the driving force behind the resilience of US equity prices, prevailing even when interest rates increased sharply (Chart C, panel b). Following the Federal Reserve’s December 2023 Federal Open Market Committee (FOMC) statement, which implied a pivot away from the restrictive monetary policy stance, interest rates exerted a smaller drag on equity prices.
Chart C
The role of equity risk premia in S&P 500 and IT sector valuations
a) Equity risk premia for selected sectors of the S&P 500
(percentages)

b) Model-based decomposition of equity returns since 2023 for selected sectors of the S&P 500
(percentages)

Sources: LSEG and ECB staff calculations.
Notes: The equity risk premium is obtained using a dividend discount model, a standard equity valuation model used for equity market monitoring and estimation of the equity risk premium. An increase in the equity risk premium means a rise in the risk compensation for holding equities, which can be interpreted as greater risk aversion. Analogously, a decline in the equity risk premium can be interpreted as decreasing risk aversion. To estimate this model for the IT sector our approach also relies on the methodology developed for the overall index in the article entitled “Measuring and interpreting the cost of equity in the euro area”, Economic Bulletin, Issue 4, ECB, 2018. The model includes share buybacks, discounts future cash flows with interest rates of appropriate maturity and includes three expected dividend growth horizons. The first period, “Pre-pivot”, refers to the change between January 2023 and the December 2023 FOMC meeting. The second period, “Post-pivot”, refers to the change between the December 2023 FOMC meeting and the latest observations. The latest observations are for 29 November 2024 (weekly data).
In view of the elevated valuations and significant stock market concentration, equities remain exposed to adverse shocks. In the current environment of a changing geopolitical landscape, elevated debt and uncertainty about both broader economic outcomes and, specifically, about future realised AI-related productivity gains, sudden shifts to “risk-off” positioning could be more likely. Model-based evidence indicates that, for example, downward revisions to the macroeconomic outlook may exert a greater impact on equity market prices during periods of elevated valuations (Chart D). In view of the currently high valuations and the significant concentration of the US equity market, such risks might become increasingly relevant.[6]
Chart D
US equity price response to negative US macroeconomic shocks, by equity valuation metrics
(percentages)

Sources: SEG and ECB staff calculations.
Notes: Impulse responses of US equity prices to adverse US macroeconomic shocks, by valuation metrics. The responses are estimated by applying threshold local projections methods to daily data, controlling for the Citi Economic Surprise Index, and are shown cumulated after one week. US macroeconomic shocks are identified in a daily Bayesian vector autoregression as proposed by Brandt, L., Saint Guilhem, A., Schröder, M. and Van Robays, I., “What drives euro area financial market developments? The role of US spillovers and global risk”, Working Paper Series, No 2560, ECB, 2021. The estimation period is from July 2005 to August 2024.
Distribution channels: Banking, Finance & Investment Industry
Legal Disclaimer:
EIN Presswire provides this news content "as is" without warranty of any kind. We do not accept any responsibility or liability for the accuracy, content, images, videos, licenses, completeness, legality, or reliability of the information contained in this article. If you have any complaints or copyright issues related to this article, kindly contact the author above.
Submit your press release